ImageData: Mandelbrot volume
Port of the mandelbrot-vti.hdf example from the VTKHDF specification: an ImageData volume sampling the Mandelbrot iteration count. The x/y axes span the complex c-plane. The z axis varies the real part of the starting value, so every slice is a different member of the Mandelbrot family. Coordinate ranges define the uniform grid (origin and spacing).
What you'll learn: how coordinate ranges define ImageData, how scalar and vector arrays follow the grid shape, and how to mark active attributes.
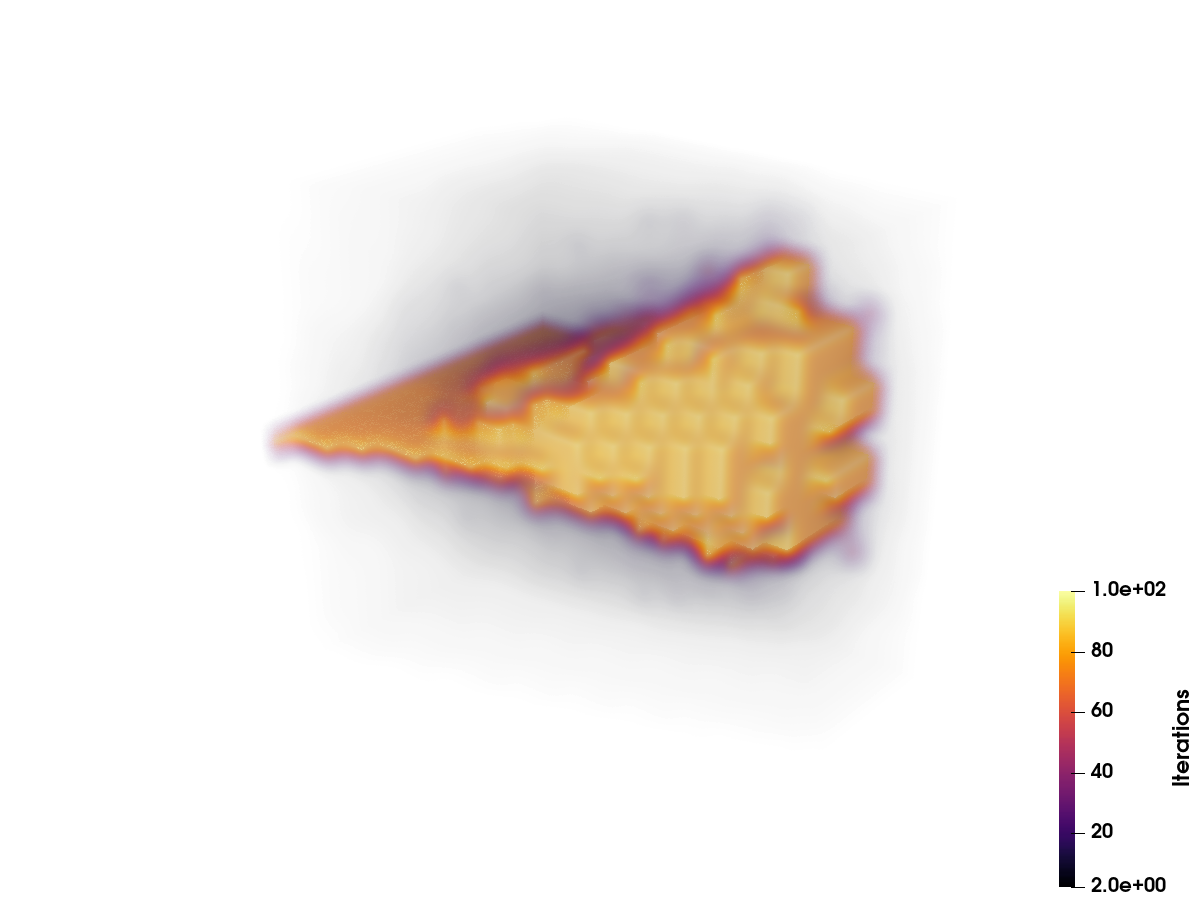
Iterations volume-rendered in ParaView:
using VTKHDFx = range(-1.75, 0.75; length = 20)y = range(-1.25, 1.25; length = 21)z = range(0.0, 2.0; length = 22)function iterations(c, w) for n in 1:100 abs2(w) > 4 && return Float32(n) w = w * w + c end return Float32(100)enditers = [iterations(complex(xi, yi), complex(zi, 0)) for xi in x, yi in y, zi in z];A central-difference gradient of the iteration count, as a (3, nx, ny, nz) vector field:
function gradient(f, spacing) g = zeros(3, size(f)...) R = CartesianIndices(f) for d in 1:3, I in R δ = CartesianIndex(ntuple(==(d), 3)) hi, lo = min(I + δ, last(R)), max(I - δ, first(R)) g[d, I] = (f[hi] - f[lo]) / ((hi[d] - lo[d]) * spacing[d]) end return gendPoint data shaped like the grid is detected automatically; attribute marks the active scalars/vectors.
vtkhdf_grid("mandelbrot", x, y, z) do vtk vtk["Iterations", VTKPointData(), attribute = :Scalars] = iters vtk["IterationsGradient", VTKPointData(), attribute = :Vectors] = gradient(iters, step.((x, y, z)))endReading it back
The grid metadata comes back through grid_info:
r = vtkhdf_open("mandelbrot")VTKHDF.grid_info(r)(dims = (20, 21, 22), origin = (-1.75, -1.25, 0.0), spacing = (0.13157894736842105, 0.125, 0.09523809523809523), direction = (1.0, 0.0, 0.0, 0.0, 1.0, 0.0, 0.0, 0.0, 1.0), whole_extent = (0, 19, 0, 20, 0, 21))Arrays are read by indexing; image-like data keeps its full 3-D shape. The marked active attributes can be queried:
size(r["Iterations"]), size(r["IterationsGradient"])((20, 21, 22), (3, 20, 21, 22))VTKHDF.active_attributes(r, VTKPointData())Dict{Symbol, String} with 2 entries:
:Vectors => "IterationsGradient"
:Scalars => "Iterations"close(r)